

.png)
.png)


Understanding how visitors interact with your website is essential for improving marketing performance. HubSpot Content Hub includes built-in analytics dashboards and reporting tools that allow teams to monitor traffic, engagement, and conversions across their website.
These reports help businesses understand which pages perform well, where visitors are coming from, and how website content contributes to lead generation.
Understanding how HubSpot Content Hub analytics dashboards and reporting work allows teams to make informed decisions about their website and content strategy.
What Are Analytics Dashboards?
An analytics dashboard provides a visual overview of website performance using charts, graphs, and metrics.
In HubSpot Content Hub, dashboards typically display information such as:
- Website traffic
- Visitor behavior
- Page performance
- Conversion metrics
Dashboards help teams quickly understand how their website is performing without needing to analyze raw data manually.
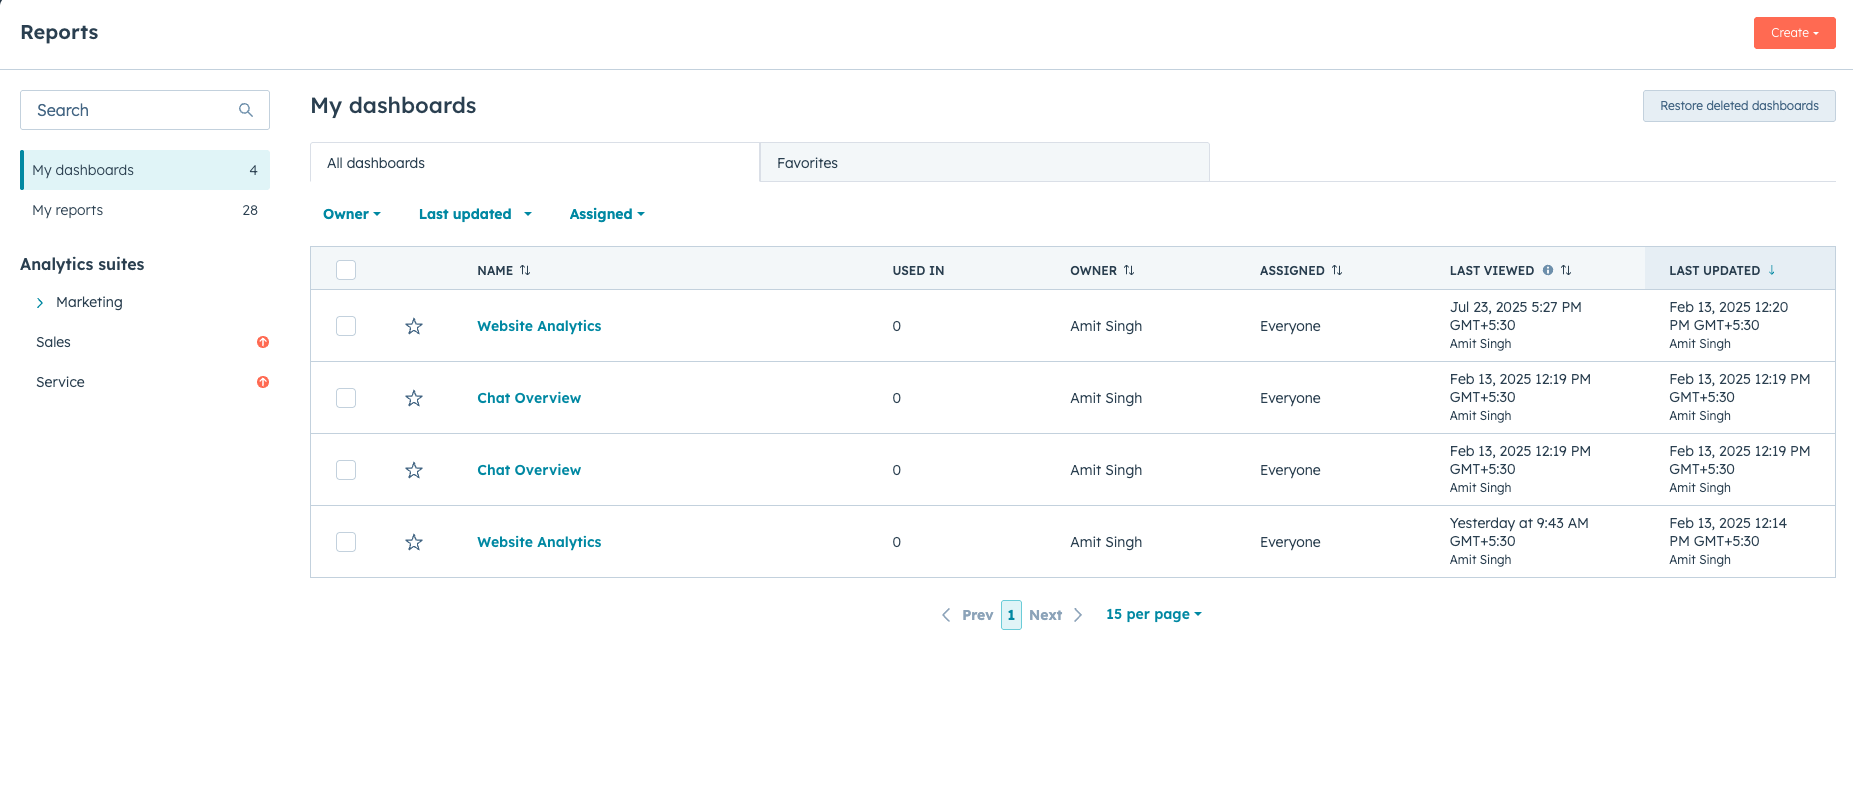
Where to Access Website Analytics
Website analytics can be accessed through the HubSpot reporting tools.
To view analytics:
Reports → Analytics Tools → Traffic Analytics
This section includes several reports that help track different aspects of website activity.
Key Website Metrics
HubSpot analytics dashboards provide a variety of metrics related to website performance.
Common metrics include:
- Page Views – number of times a page is viewed
- Unique Visitors – number of individual users visiting the site
- Average Time on Page – how long visitors spend reading content
- Bounce Rate – percentage of visitors who leave without interacting further
- Conversion Rate – percentage of visitors who complete a desired action
Tracking these metrics helps businesses evaluate the effectiveness of their content.
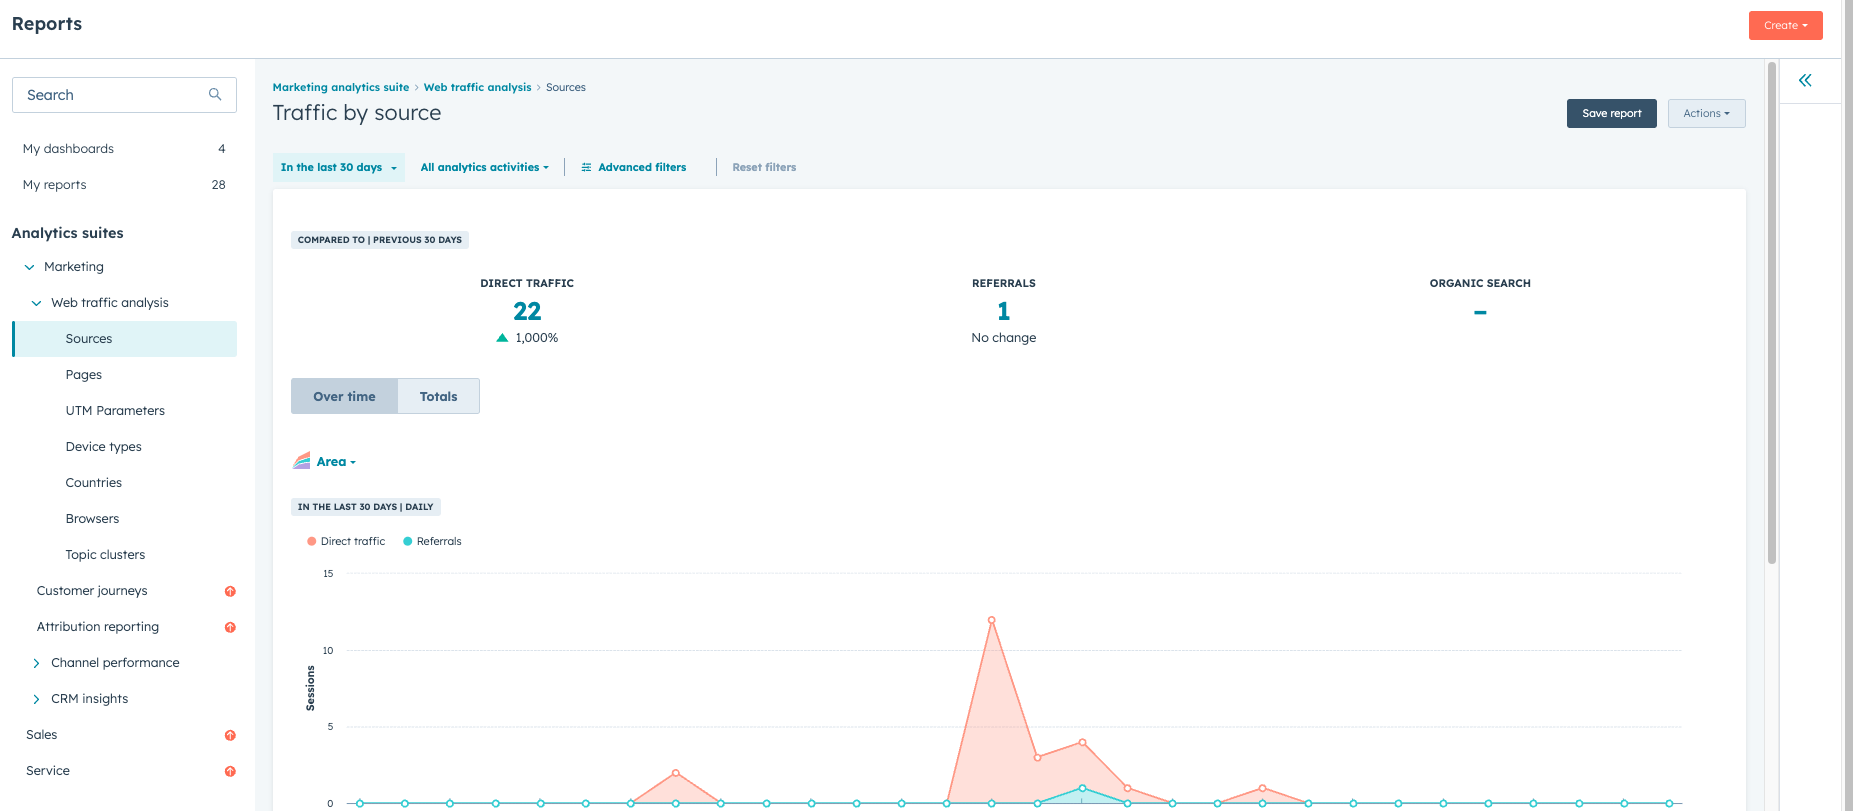
Traffic Sources
HubSpot also provides insights into where website visitors are coming from.
Traffic sources typically include:
- Organic search (Google and other search engines)
- Direct visits
- Social media platforms
- Email campaigns
- Referral websites
Understanding traffic sources helps teams identify which marketing channels are driving visitors to the site.
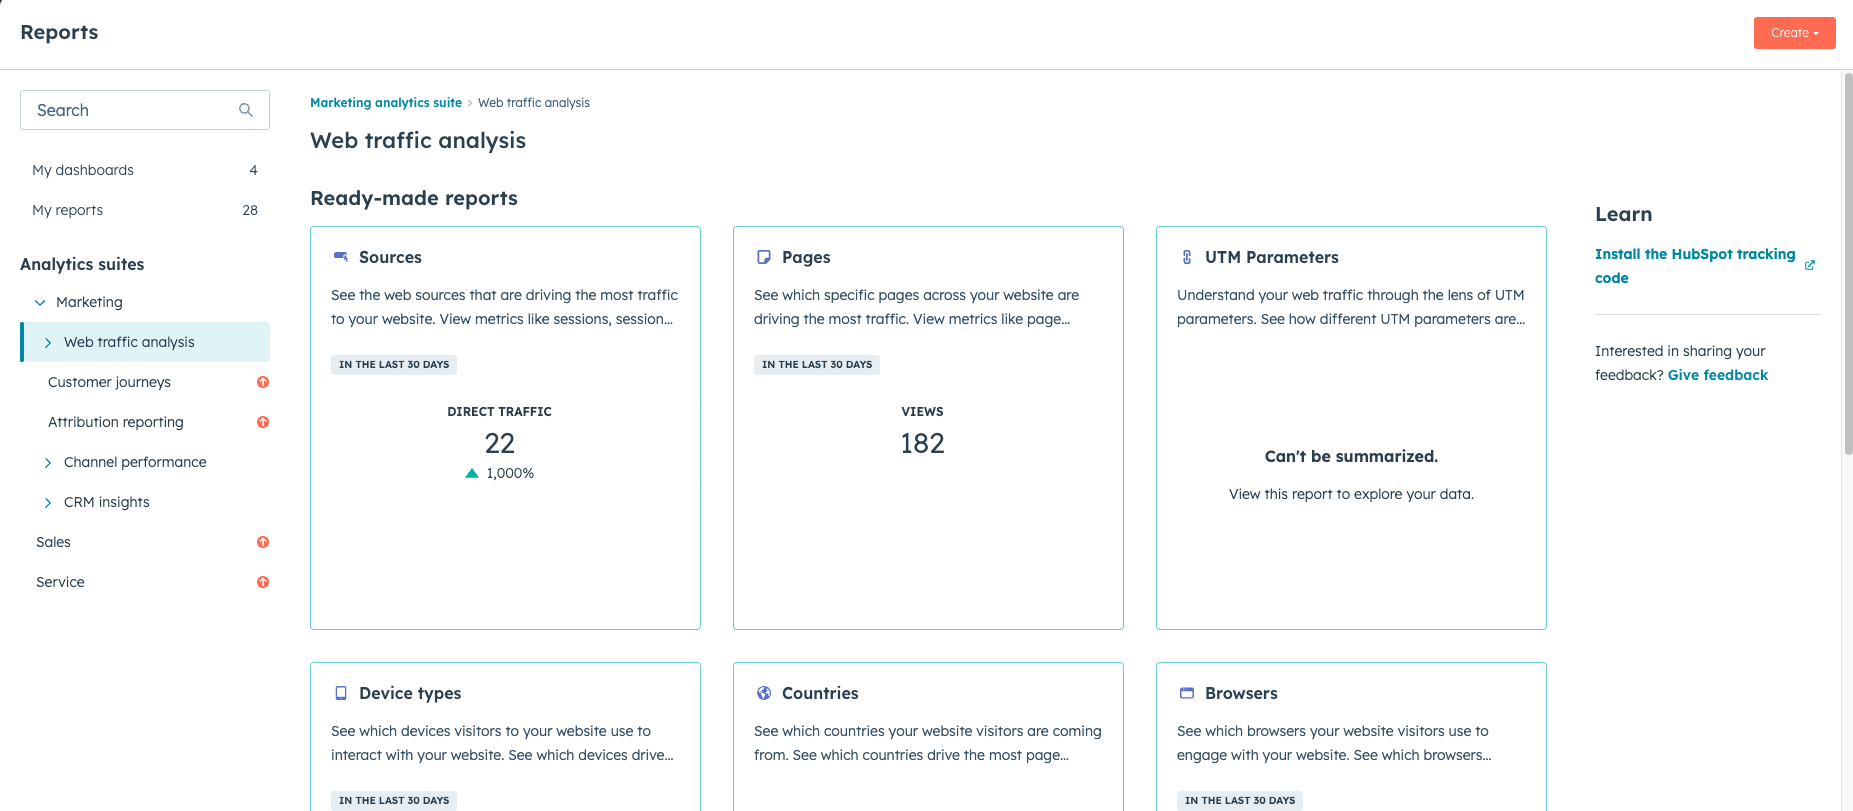
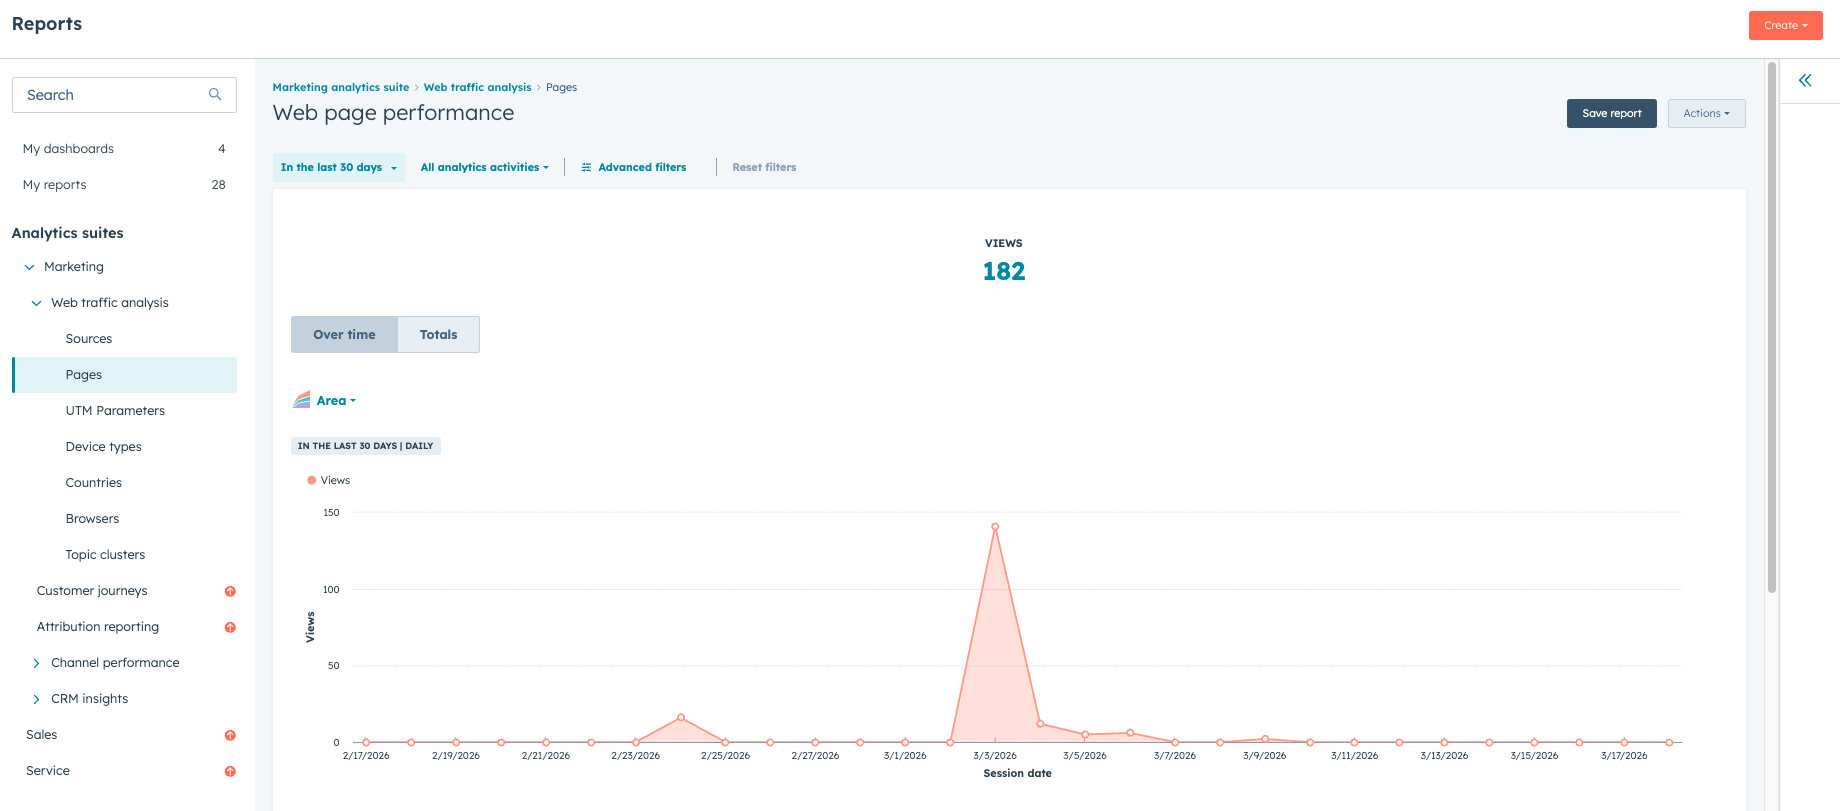
Page Performance Reports
HubSpot Content Hub allows teams to analyze the performance of individual pages.
Page reports typically include data such as:
- Page views over time
- Engagement metrics
- Conversion performance
These reports help identify which pages attract the most traffic and which pages generate leads.
Key Takeaway
HubSpot Content Hub analytics dashboards provide valuable insights into website traffic, engagement, and conversions. By analyzing this data, teams can better understand how visitors interact with their website and make improvements that support marketing and business goals.
Related Post

How Do You Create a Page in HubSpot Content Hub?
Creating a page in HubSpot Content Hub is a straightforward process. The platform provides a visual page editor that allows marketers and content teams to build pages without writing code.

How Does HubSpot Content Hub Schedule Blog Posts?
Publishing blog content consistently is important for maintaining an active website and engaging your audience. HubSpot Content Hub makes this easier by allowing users to schedule blog posts in advance.

How Do You Duplicate a Page in HubSpot Content Hub?
Duplicating a page in HubSpot Content Hub is a useful feature that allows you to quickly create a copy of an existing page. Instead of building a new page from scratch, duplication lets you reuse the same layout, modules, and content structure.
Power Up Your Project
Request a Quote and Let Us Save the Day!

Leave a reply